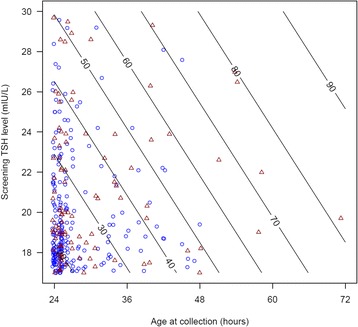
Fig. 1.

Scatter plot of screening-TSH level 17–30 mIU/L and age of sample collection. Red triangles represent true positive subjects and blue circles represent false positive subjects whose screening TSH level was 17–30 mIU/L. Contours represent estimate of probability of CH for any given screening-TSH/age of sample collection pair
