
Fig. 5.
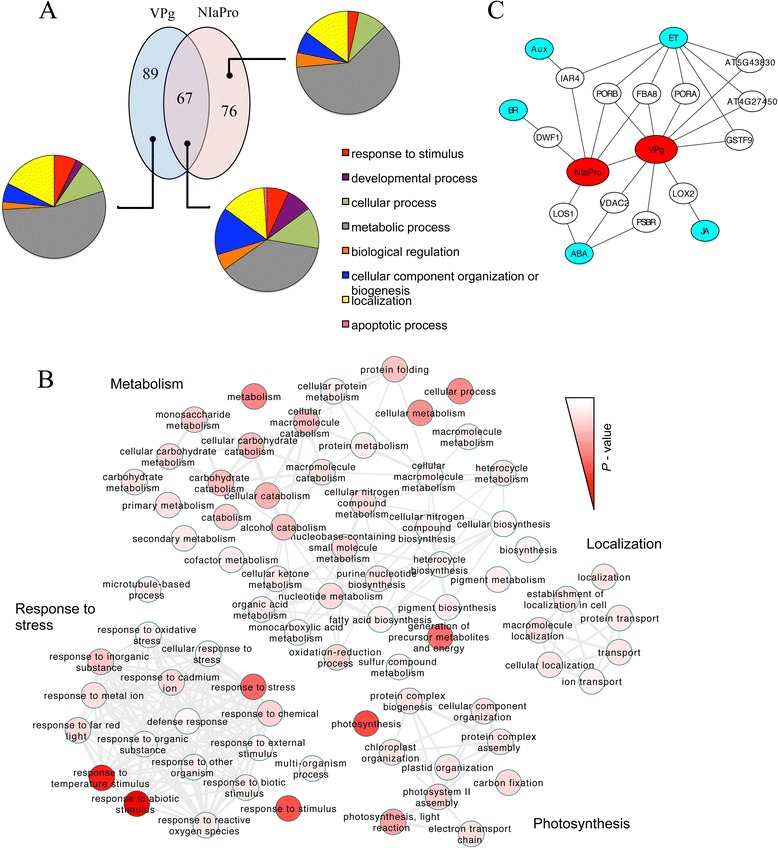
TEV NIa-host functional networks. a Venn diagrams showing the number of host proteins targeted by the VPg and NIaPro domains of TEV NIa during infection, together with a functional analysis of the global categories over-represented. b Map of the different biological functions (GO terms) over-represented within the complete list of targeted host proteins (VPg, NIaPro and common). Representation obtained with REVIGO. Red intensity corresponds to the P-value. c Network representing the relationship between NIa-targeted host proteins and phytohormones. This network was obtained taking advantage of the Arabidopsis Hormone Database