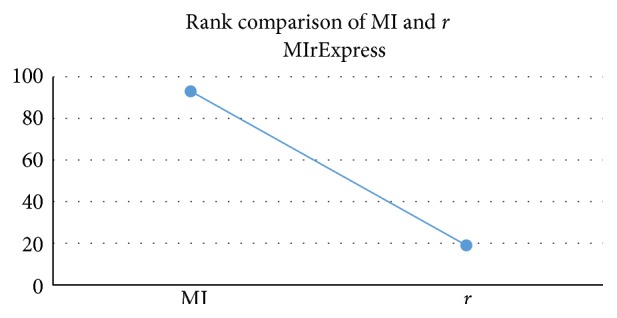
Figure 4.

Page for pairwise correlation analysis. The scatter diagram of probe set pair is omitted which appears as Figures 3(a), 3(b), 3(c), 3(d), and 3(e). The species is “human”; the dataset is “CD3+ T cell”; for Gene A, the probe set ID is “1007_s_at” and the gene symbol is “DDR1”; for Gene B, the probe set ID is “1053_at” and the gene symbol is “RFC2.” The Pearson's r value is −0.05538, the MI value is 1.04368, and the MIr value is 0.36477 for their hybrid.
