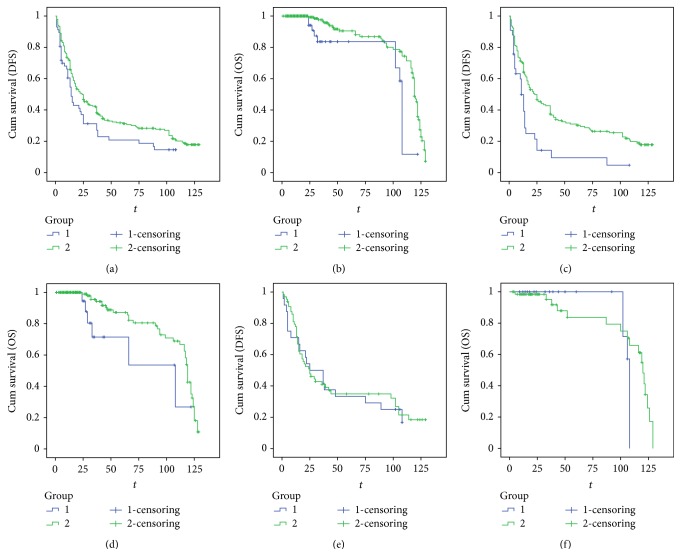
Figure 2.
Relationship between DFS or OS and CADM1/TSLC1 expression. (a) Relationship between DFS and CADM1/TSCL1 expression in all patients with ESCC; (b) Kaplan-Meier curves for the correlation between OS and CADM1/TSCL1 expression in all patients with ESCC; (c) Kaplan-Meier curves for the correlation between DFS and CADM1/TSCL1 expression in male patients with ESCC; (d) Kaplan-Meier curves for the correlation between OS and CADM1/TSCL1 expression in male patients with ESCC; (e) Kaplan-Meier curves for the correlation between DFS and CADM1/TSCL1 expression in female patients with ESCC; (f) Kaplan-Meier curves for the correlation between OS and CADM1/TSCL1 expression in female patients with ESCC.

