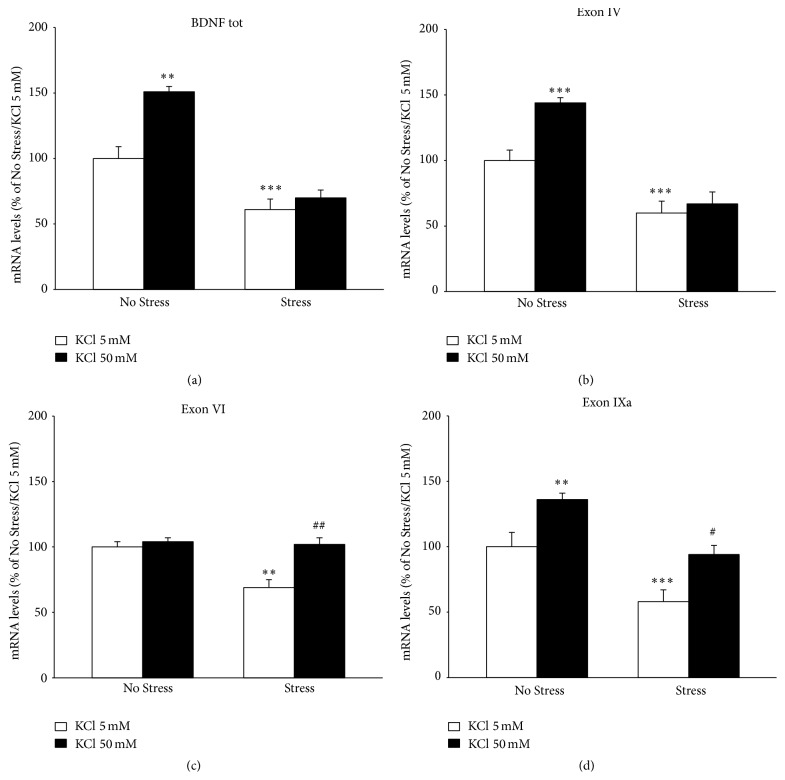
Figure 3.
Analyses of BDNF gene expression. The mRNA levels of the total form of BDNF (a), BDNF isoform IV (b), isoform VI (c), and isoform IXa were measured by qRT-PCR in hippocampal slices obtained from unstressed (No Stress) or chronically stressed (Stress) rats exposed to KCl-induced depolarization (KCl 50 mM). The data, shown as a percentage referring to control group (No Stress/KCl 5 nM), are the mean ± SEM of independent determinations. ∗∗ P < 0.01, ∗∗∗ P < 0.001 versus No Stress animals/KCl 5 nM; # P < 0.05, ## P < 0.01 versus Stress/KCl 5 nM. Two-way ANOVA with SCPHT.

