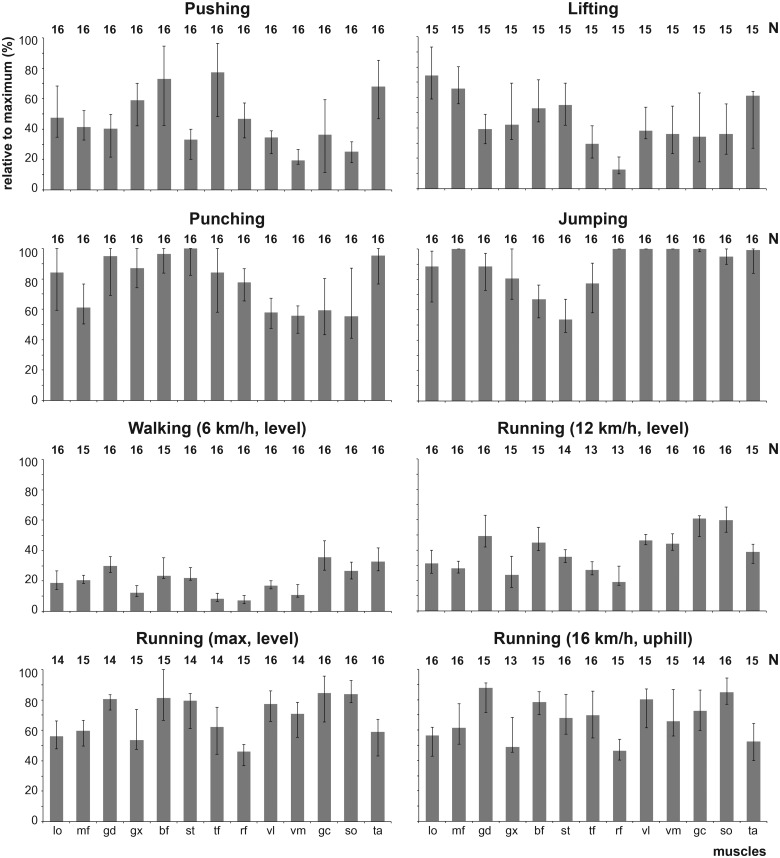
Fig. 4.
Median peak activity observed in the 13 muscles graphed for each of the 8 behaviors to illustrate the level of variation in peak activity among the muscles. Sample sizes for the subjects per muscle are indicated above each graph. For abbreviations of the muscles, see Table 1.

