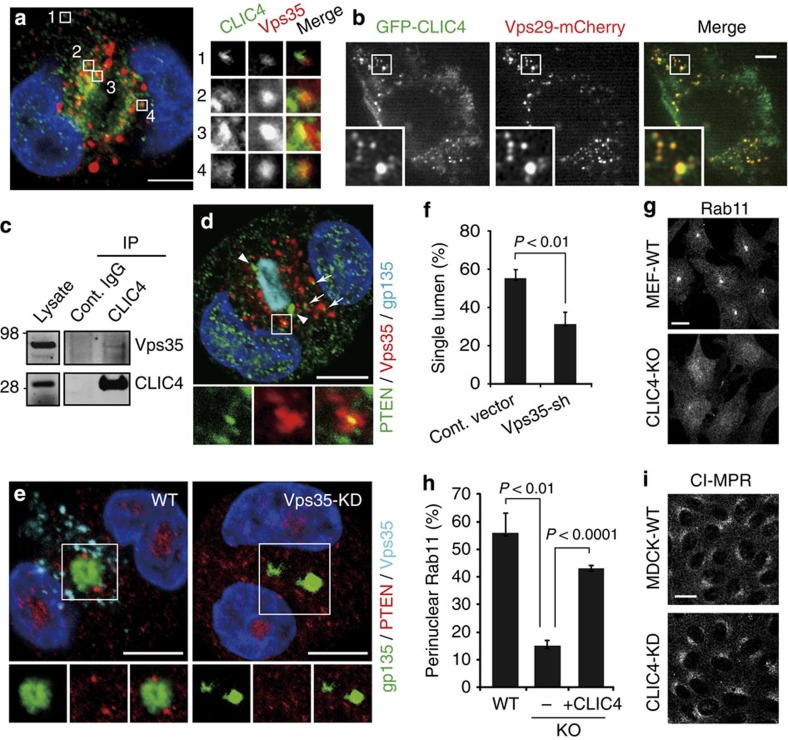
Figure 6. CLIC4 regulates retromer-mediated apical sorting on EE.
(a) A representative confocal image shows an early (1-day) WT cyst labelled for CLIC4 and Vps35. Enlarged views of the boxed areas (1-4) on the right show the close association between CLIC4 and Vps35 on EE. Pearson's coefficient=0.35±0.04 (n=8). (b) A representative frame of the time-lapse video taken from a transfected MEF expressing low levels of GFP-CLIC4 and Vps29-mCherry (see Supplementary Movie 1). Enlarged views of the boxed area demonstrate the extensive colocalization of these two molecules. Pearson's coefficient=0.64±0.16 (n=11). (c) Immunoblots of total membrane lysates of MDCK cells and immunoprecipitates pulled down by using either the host species-matched control (cont.) IgG or anti-CLIC4 antibody. (d) A representative image shows an early (1-day) WT cyst triply labelled for PTEN, Vps35 and gp135. Enlarged view of a boxed area highlights the close association between PTEN and Vps35, which was frequently seen in the apical cytoplasm (arrows). Arrowheads show the steady-state PTEN location at TJs. gp135 labelled the nascent luminal PM. Pearson's coefficient (PTEN versus Vps35)=0.28±0.09 (n=4). (e) Examples of triple-labelled early cysts (1-day) formed by MDCK cells transfected with vector alone or Vps35-shRNA. Enlarged views of the boxed areas are shown. Note the reduction of Vps35 labelling in the Vps35-shRNA transfected cells, as well as the disappearance of PTEN at TJs surrounding the nascent lumen. (f) Percentage of 3-day cysts containing a single lumen. Error bars represent standard deviation; P value by t-test; n>450; 3 repeats. (g) Immunolabelling of Rab11a. Instead of enriching as the perinulcear punctate in WT MEFs, Rab11a appeared diffuse in the cytoplasm in CLIC4-KO MEFs. (h) Percentage of cells (WT MEF, CLIC-KO MEF without (−) or with (+) the transfection of Flag-CLIC4) displaying perinuclear enrichment of Rab11a labelling. Error bars represent standard deviation; P value by t-test; n>250; 3 repeats. (i) Similar TGN distribution of CI-MPR was found in WT and CLIC4-KD MDCK cells. Scale bars, 10 μm (a,b,d,e,g,i).

