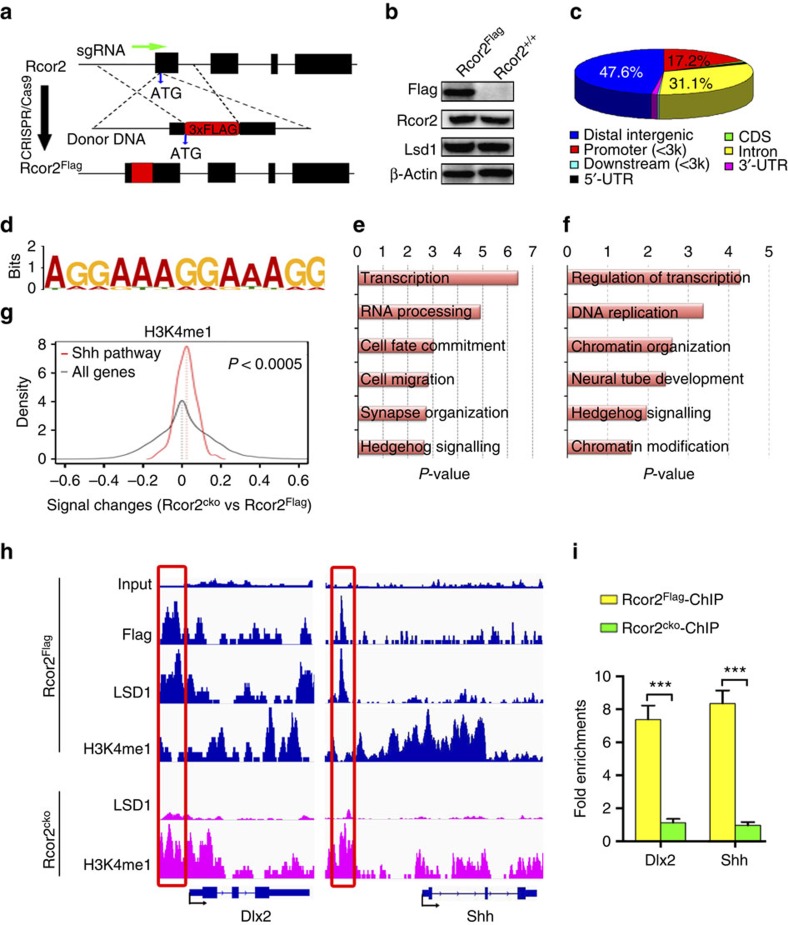
Figure 4. ChIP-seq analysis of Rcor2 enrichments in genome-wide scale reveals direct binding of Rcor2 at regulatory regions of genes related to Shh signalling pathway.
(a) Schematic overview of strategy to generate an Rcor2Flag knock-in allele by CRISPR/Cas9. The sgRNA sequence site is shown as a green arrowhead. The start codon of Rcor2 is indicated and capitalized. The oligo donor contained 50 bp homologies on both sides flanking the DSB, in which 3 × Flag sequences are labelled as a red box. (b) Western blot analysis to validate FLAG, RCOR2 and LSD1 expressions in Rcor2Flag knock-in neocortex using Flag-M2 antibody. β-Actin was used as an endogenous control. (c) Pie chart depicts distribution of Rcor2 occupancies in genome-wide scale in FLAG ChIP-seq results using Rcor2Flag knock-in neocortex at E13.5. (d) WebLogos of consensus binding motifs of Rcor2 generated by Multiple EM for Motif Elicitation (MEME) motif analysis tool. (e) GO analysis for Rcor2-binding regions in genome-wide scale revealed by Flag ChIP-seq results using Rcor2Flag brain. (f) GO analysis for LSD1 occupancy in genome-wide scale revealed by LSD1 ChIP-seq results using Rcor2Flag brain. (g) Density plots analysis of H3K4me1 signal change in promoter regions (−2- to ∼0.5 kb from TSS) on Rcor2 depletion. Compared with all genes, the change of H3K4me1 signal is significantly (P<0.0005, Kolmogorov–Smirnov test) enhanced in the promoter regions of Shh pathway-related genes on Rcor2 depletion. H3K4me1 signal change on Rcor2 depletion (x axis); H3K4me1 signal density (y axis). (h) Gene tracks of Rcor2, LSD1 and H3K4me1 enrichments by ChIP-seq analysis at core promoter regions of Dlx2 and upstream regulatory regions of Shh, which are closely related to Shh signalling. (i) ChIP–qPCR analysis of Rcor2Flag and Rcor2cko cortex at E13.5 using specific FLAG-M2 antibody. Significant enrichments of the Rcor2 at the regulatory regions of Dlx2 and Shh gene locus detected in g in the Rcor2flag samples are worth noting. Fold enrichments of Rcor2 occupancy compared with input (y axis). Data are shown as mean±s.d., t-test, ***P<0.001, n=3.

