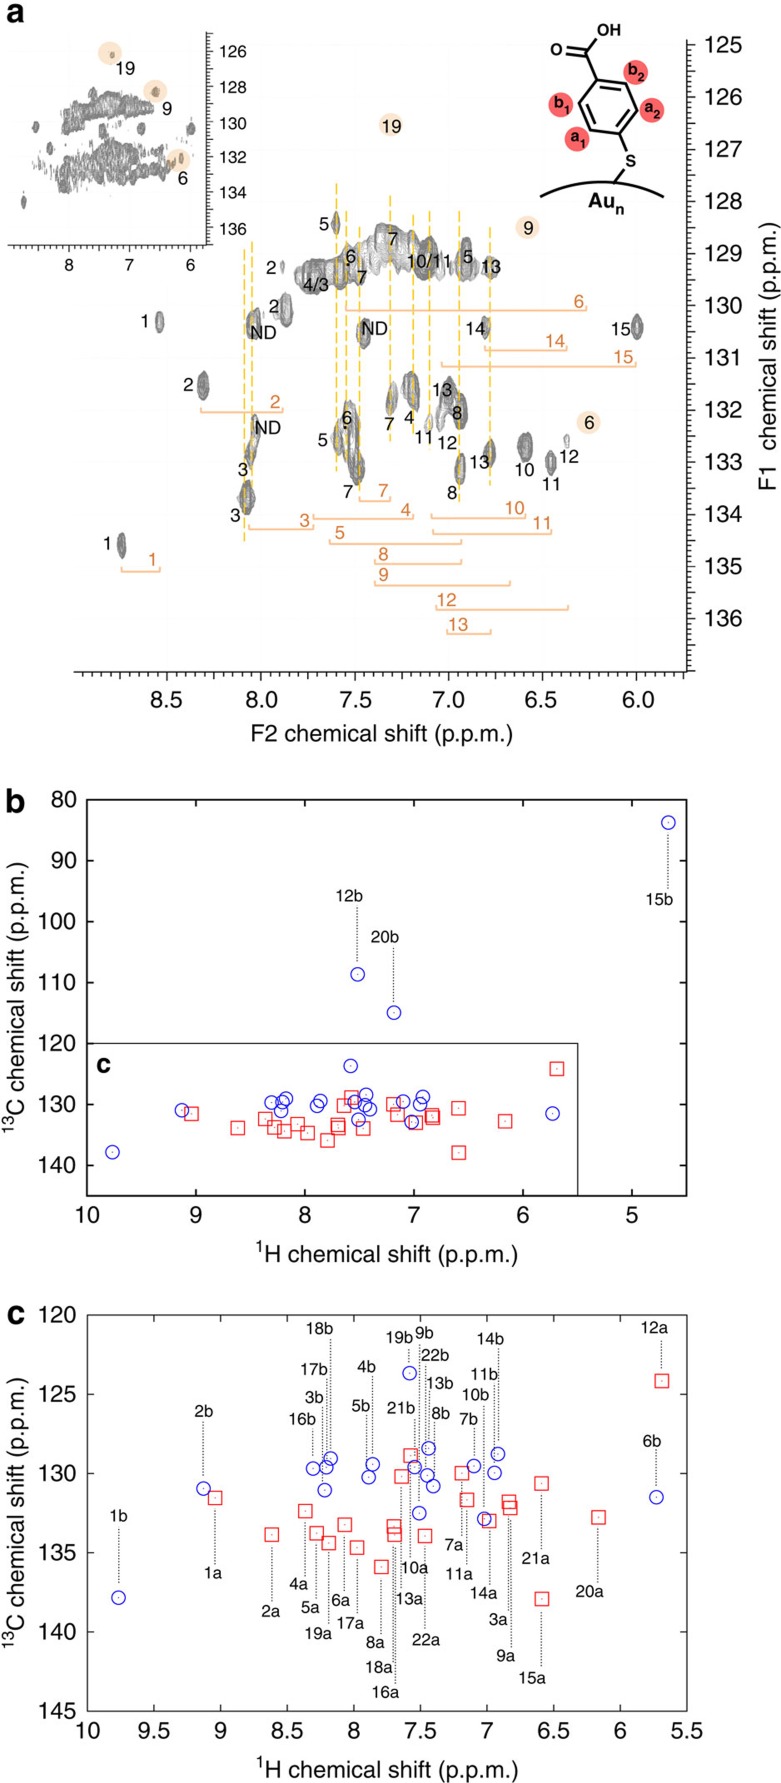
Figure 4. HSQC data.
(a) HSQC spectrum of Au102(pMBA)44 cluster in 0.3 M D2O–NaOH showing assignment of 1H–13C correlation peaks. For some of the less-mobile ligands, correlation peaks for both a1 and a2 and/or b1 and b2 carbons could be identified. Inset shows the entire spectrum with higher signal-to-noise level and ND denotes ‘not determined'. (b,c) Calculated 1H–13C correlation chemical shifts. (c) The congested area in b in a larger scale.

