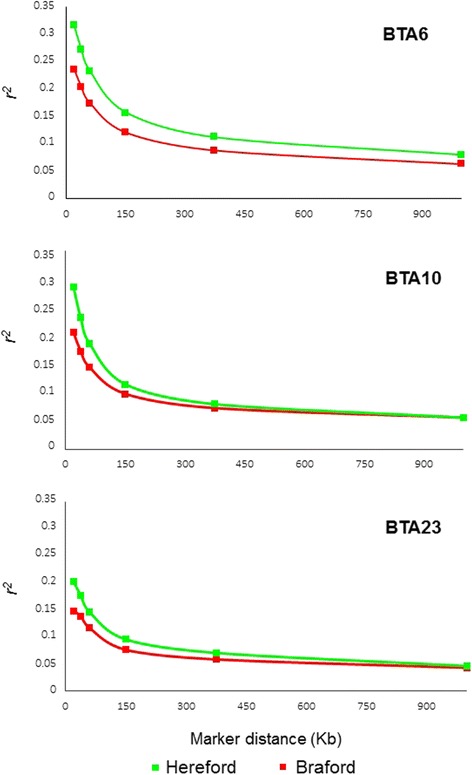
Fig. 3.

Predicted r 2 as a function of inter-marker distance considering different panels densities. Square symbols pinpoint predicted r 2 at distances of 20, 38, 60, 150, 375 and 1000 Kb corresponding, respectively, to average physical distances expected for panels of 150K, 80K, 50K, 20K, 8K, and 3K equally-spaced markers in chromosomes 6 (BTA6), 10 (BTA10) and 23 (BTA23) for Hereford and Braford populations
