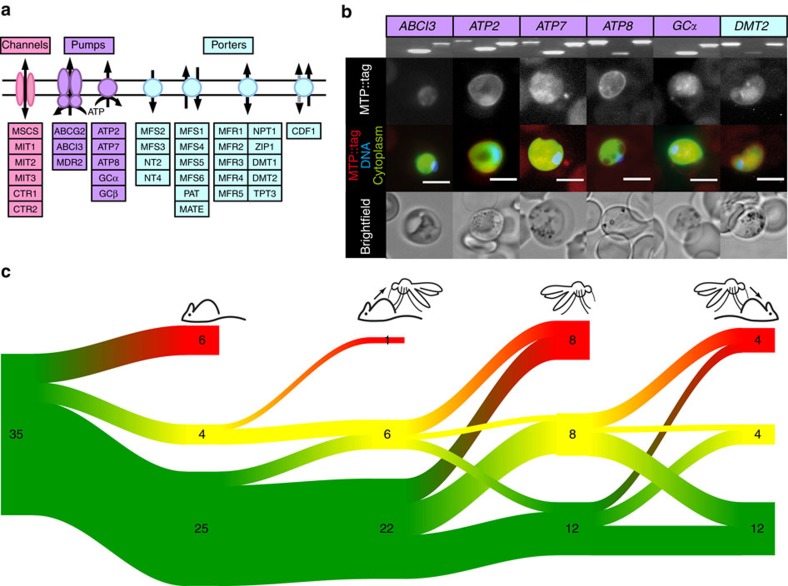
Figure 1. Experimental genetics screen of malaria parasite orphan membrane transport proteins.
(a) Schematic overview of the 35 conserved, P. berghei orphan MTPs targeted in this study. (b) Endogenous fluorescent tagging of six MTPs refractory to targeted gene deletion to validate accessibility of gene loci. Diagnostic PCRs of the parental parasite populations (left, WT; centre, 5′ integration; right, 3′ integration; see Supplementary Fig. 5 for full gel pictures) and representative live fluorescent micrographs of blood-stage parasites are shown. Scale bars, 5 μm. (c) Sankey diagram for parasite development at four life cycle checkpoints. Parasite lines are enumerated and coloured according to complete arrest (red), slow development (<10% percentile; yellow), and normal growth (green). The Sankey diagram was created with the package riverplot (v. 0.5) available from CRAN (https://cran.r-project.org/web/packages/riverplot/).

