Fig. 2.

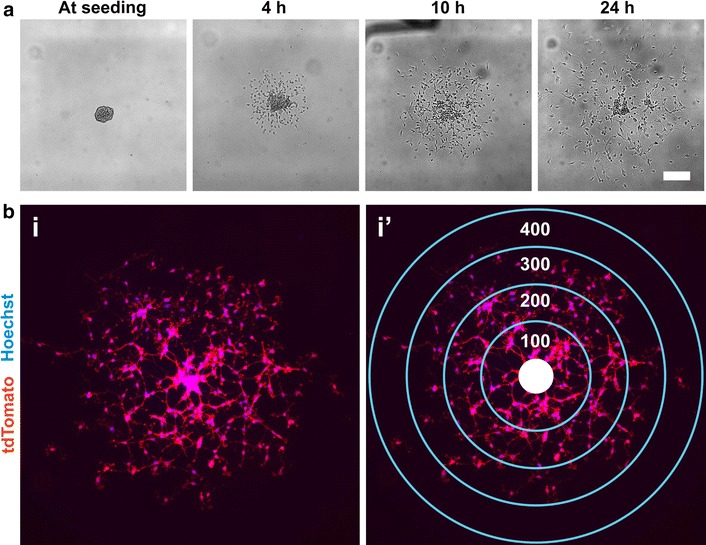
Seeding OPCAs on migration-permissive substrates yields a quantitative means to assess OPC motility. a Time-lapse phase contrast microscopy of an OPCA from which OPCs emerge radially over a 24 h period. b A 10 h migrated OPCA before (i) and after (i’) superimposing concentric rings (100 µm increments) over the residual OPCA core (solid white circle). Migration distance can be conveyed as the proportion of cells in each ring or the total number of migrated cells regardless of distance. Membrane-targeted tdTomato (red) facilitates visualization of cell bodies. Scale bar, a 50 µm
