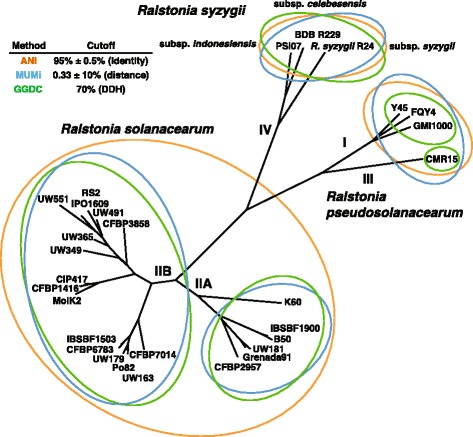
Fig. 2.

Phylogenetic network derived from genomic distances. The distance matrices were generated with ANI, MUMi and GGDC methods and the combined tree was created with the SplitsTree4 software. The orange, blue and green cells represent strains clustered into species using the criteria specific to the ANI, MUMi and GGDC methods, respectively
