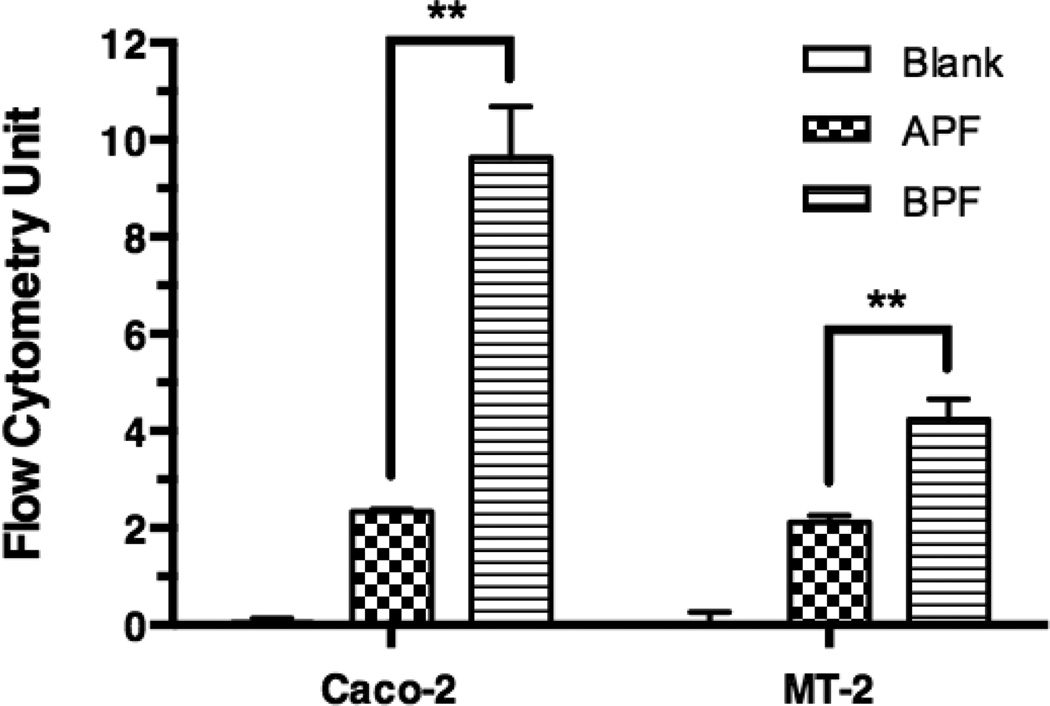
Figure 7. Total cell-associated fluorescence levels of NCs in Caco-2 and MT-2 cells as measured by flow cytometry.
Caco-2 cells and MT2 cells were incubated with medium (Blank), 10 µM of APF, or 10 µM BPF for 2 h and washed before flow cytometry. The total cell-associated fluorescence levels are mean ± s.d. of at least of two independent experiments. One-way ANOVA analysis followed by Tukey multiple comparison test were performed. The symbol “**” indicates that the fluorescence level of BPF in both cell types was significantly higher than that of APF (p < 0.01).

