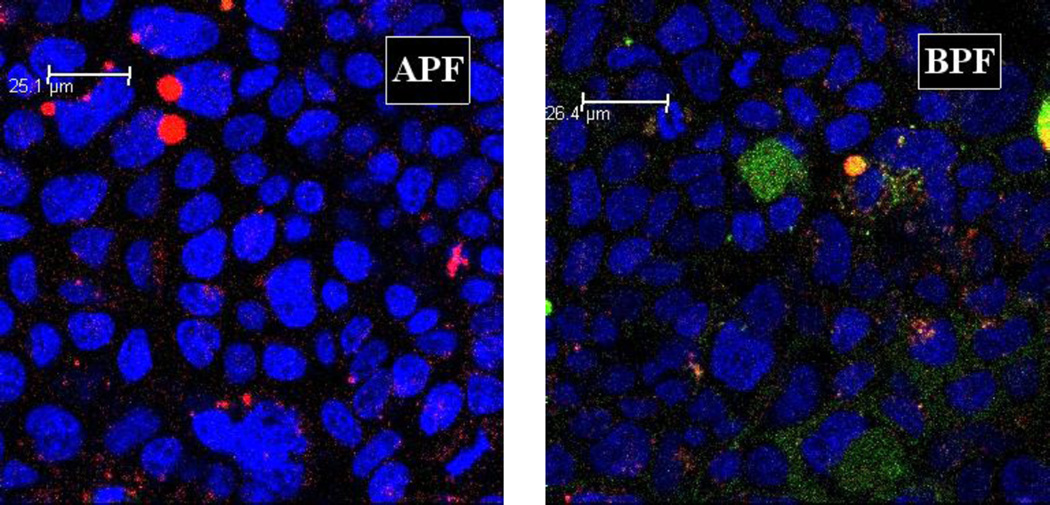
Figure 9. Confocal microscopic images of Caco-2 cells incubated with APF (left) or BPF (right) at 2.47 × magnification.
Caco-2 cells three days after confluence were treated as described in Fig. 8. A middle section in a stack is shown. Each image was merged from three separate blue, green and red images of the same field. Two features are clear. The first is the sharp contrast between lack of green intracellular fluorescence in APF-treated cells (APF) and significant green intracellular fluorescence in BPF-treated cells (BPF). The second one is lack of co-localization of green and red fluorescence in the BPF image, indicating that most intracellular green fluorescence was located in the cytosol/nucleus compartment. Note in the APF image there are a few blobs of red fluorescence at the upper-left corner that are likely to be artifacts of cell debris.

