Fig. 2.

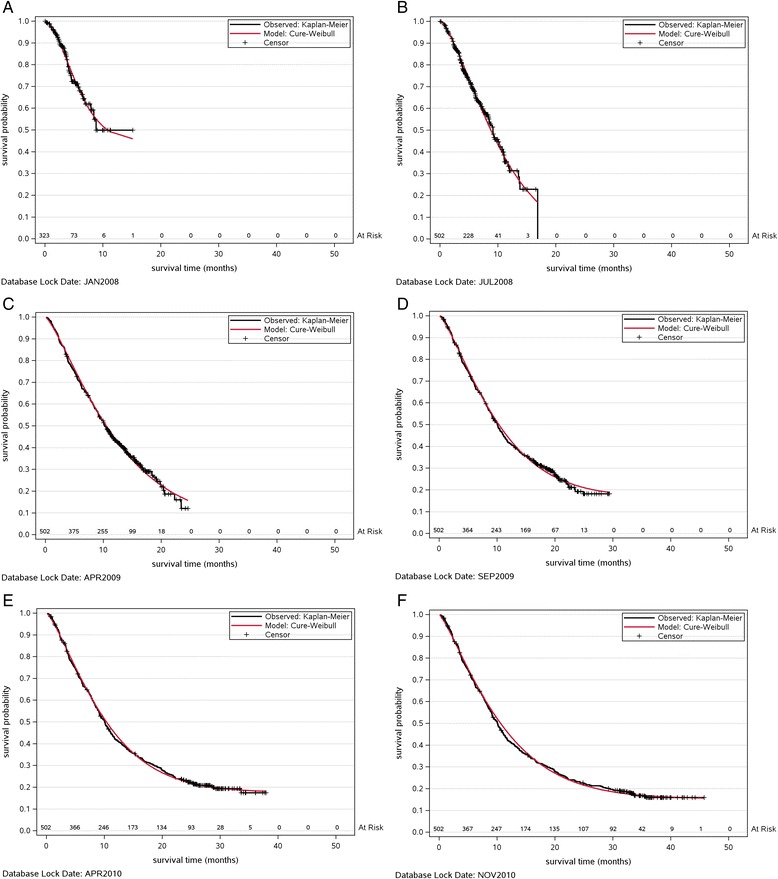
Parametric mixture cure rate modeling over time. a–f shows the observed Kaplan-Meier survival curve (black) and the predicted curve (red) fitted with Weibull mixture cure rate model using data up to prediction times between 2008 and 2010

Parametric mixture cure rate modeling over time. a–f shows the observed Kaplan-Meier survival curve (black) and the predicted curve (red) fitted with Weibull mixture cure rate model using data up to prediction times between 2008 and 2010