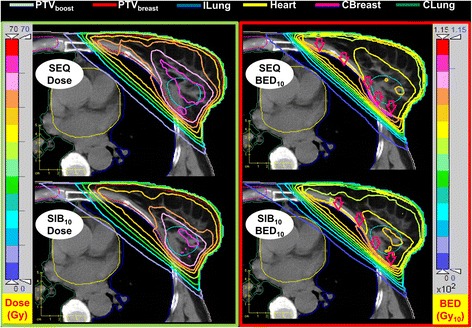
Fig. 1.

Dose (left column and BED (right column) distribution for a representative case using the sequential boost and the simultaneously integrated boost schemes employing the same prescribed biologically effective dose with α/β = 3 Gy for all OARs and α/β = 10 Gy for target volumes in 28 fractions. Due to the difference in α/β, the maximum BED values occur outside the target volumes (red arrows)
