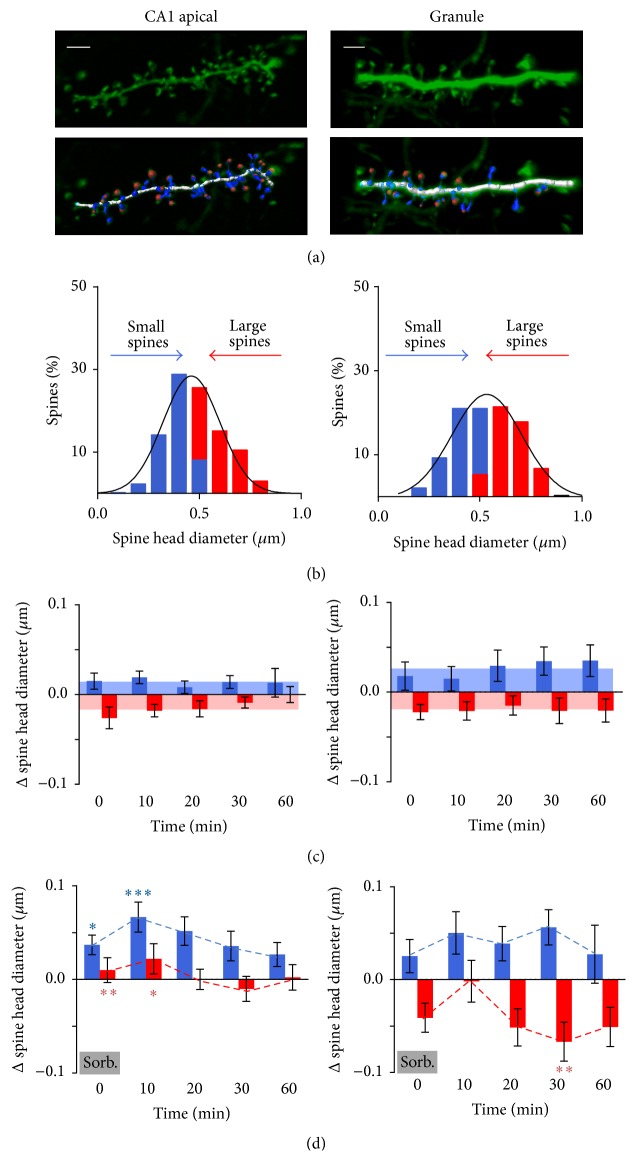
Figure 1.
Control data from CA1 pyramidal cells or DG granule cells tend to fluctuate towards the mean but are similar over time (left panels: CA1 pyramidal cells; right panels: DG granule cells). (a) 3D reconstruction of deconvolved confocal images of sections of dendrite of a hippocampal organotypic slice and model of the dendritic spines as superimposed by Imaris. Scale bar: 2 μm. Note one large spine not modelled by Imaris (see Section 2). (b) Before application of TEA, estimated spine head diameters are normally distributed. Small (blue) and large (red) spines are defined as spines with diameters less or greater than the mean diameter, respectively. (c) Change in spine diameter after repeated imaging in control ACSF. Limits of the shaded region represent the mean of all time points for small (blue) and large (red) spines. (d) Change in spine diameter after repeated imaging following transient high osmolarity ACSF perfusion (50 mM sorbitol, 5 min). Dotted line represents mean change of small (blue) and large (red) spines at that time point. Note the data at time 0 are sampled during the sorbitol wash-in. Post hoc analysis of control data versus sorbitol (3-way interaction between size, time, and treatment): ∗ p < 0.05; ∗∗ p < 0.01; ∗∗∗ p < 0.001.

