Figure 2.

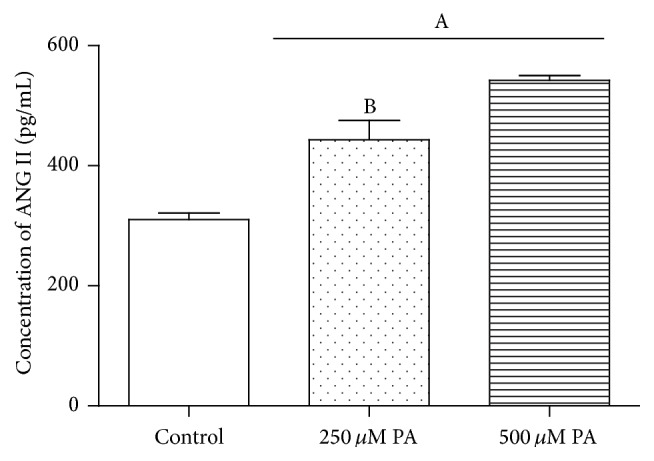
Concentrations of ANG II secreted by 3T3-L1 adipocytes after being treated by different concentrations of PA. Data are presented as mean ± SD. (A) P < 0.05 versus control, (B) P < 0.05 versus 500 μM PA (, n = 6).

Concentrations of ANG II secreted by 3T3-L1 adipocytes after being treated by different concentrations of PA. Data are presented as mean ± SD. (A) P < 0.05 versus control, (B) P < 0.05 versus 500 μM PA (, n = 6).