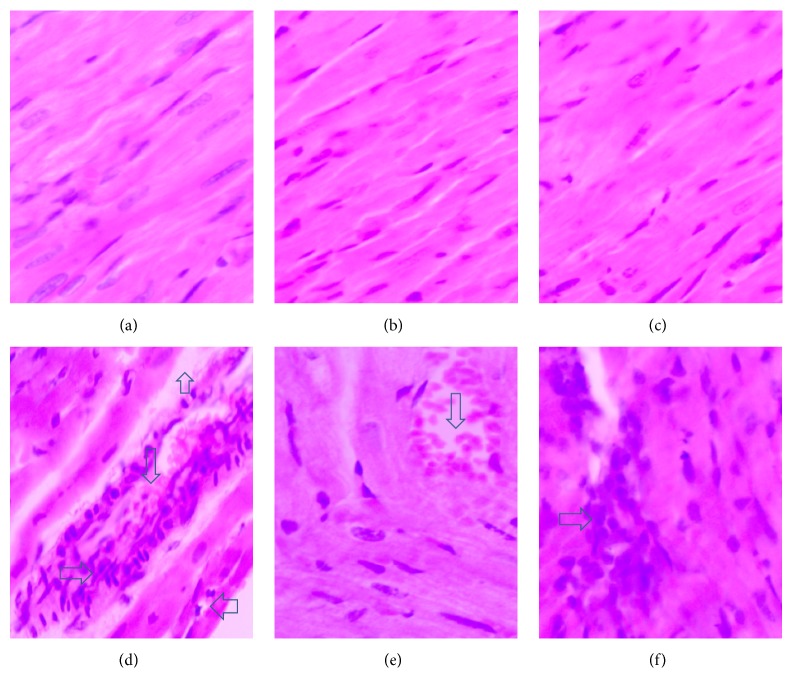
Figure 1.
Photomicrography of histopathological changes in the studied different animal groups. (a), (b), and (c) represent normal cardiac tissue sections from the control, metformin, and sitagliptin groups, respectively. (d) shows extensive myocardial degeneration (up arrow), perinuclear vacuolization (left arrow), inflammatory cells (right arrow), and interstitial hemorrhage (down arrow) found in the DOX group. (e) and (f) show significant improvement in the pathological features in the metformin/DOX and sitagliptin/DOX groups, respectively, as compared to (d). Sections were stained with H&E and magnification used was 200x.

