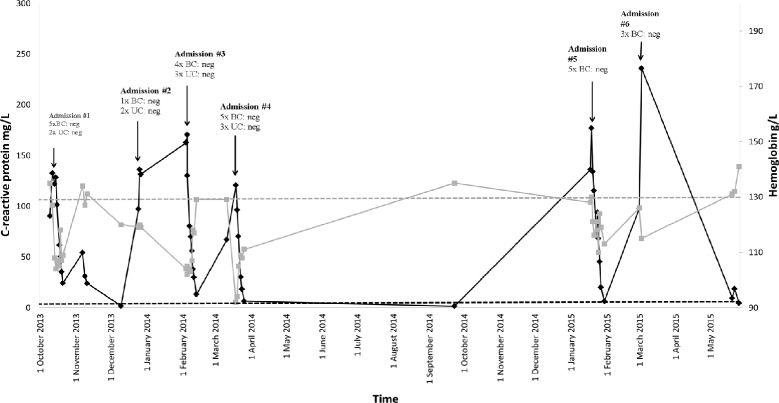
Fig. 1.

Summary of hospital admissions spanning 20 months. Data from six hospital admissions between October 2013 and May 2015 are shown. C-reactive protein is shown on the left y-axis (black) with upper limit of normal 5 mg/L (black dashed line). Haemoglobin is shown on the right y-axis (gray) with lower limit of normal 130 g/L (gray dashed line). BC blood culture; UC urine culture
