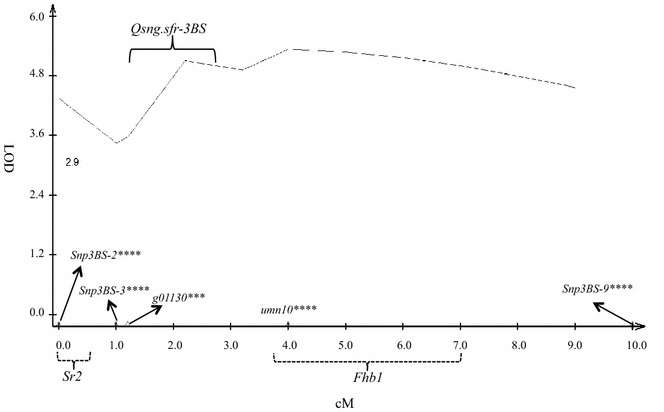
Fig. 5.

Interval mapping analysis of chromosome 3BS for Stagonospora nodorum blotch resistance gene Qsng.sfr-3B mapped in a 1600-individual F2 population derived from a cross between Arina and a doubly homozygous F2 progeny from a cross between Alsen and Ocoroni86. LOD values (y axis) were determined from a phenotyping experiment of the 1600 progeny for SNB resistance in a greenhouse. Map distances in centiMorgans are indicated along the x axis. Marker names are indicated with arrows according to their map orders and distances. Probable locations of the resistance QTL are indicated by solid or dashed brackets, with dashed for Sr2, solid for Qsng.sfr-3B and dashed for Fhb1
