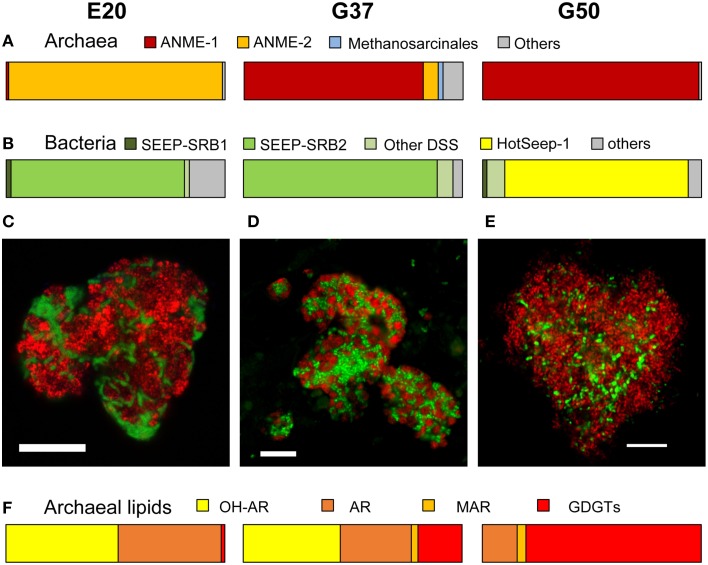
Figure 1.
Comparison of community composition, typical microbial aggregates and archaeal lipids of the three AOM enrichment cultures. (A,B) Comparison of normalized archaeal and bacterial clone numbers retrieved from the enrichment (for clone number see Table 1; short, badly aligning sequences were not considered here). (C–E) Fluorescence in situ hybridization of dual-species aggregates in the enrichment (E20: red = ANME-2-538, Treude et al., 2005; green = DSS658, Manz et al., 1998; G37: red = ANME-1-350, Boetius et al., 2000, green = DSS658; G50: red = ANME-1-350, green = HotSeep-1-590, Holler et al., 2011b; bars scale 10 μm). (F) Major archaeal membrane intact polar lipid types defined by hydrophobic core groups OH-AR, hydroxyarchaeol; AR, archaeol; MAR, macrocyclic archaeol; GDGT, glyceroldibiphytanylglyceroltetraether. At higher temperatures ANME-1 archaea tend to produce predominantly GDGTs, likely a temperature adaption (for details and 60°C example see Table 2).

