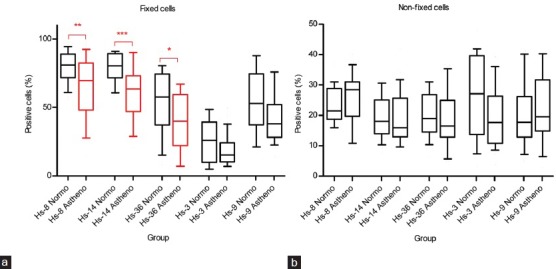
Figure 2.

The differences in the number of stained cells (%) between the normozoospermic and asthenozoospermic sperm samples among different antibodies. Middle line indicates arithmetic mean, boxes indicate the 25th and 75th percentiles, whiskers indicate the 10th and 90th percentiles. The statistically significant differences are indicated by red color and asterisks (*P ≤ 0.05, **P ≤ 0.01, ***P ≤ 0.001). (a) fixed cells, (b) nonfixed cells.
