
Figure 4.
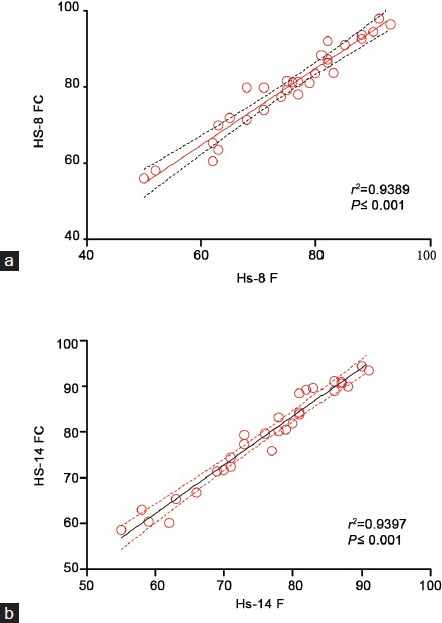
The correlation between the number of the cells stained by Hs-8 and/or Hs-14 in fluorescent microscopy analysis (%) and number of positive cells analyzed by flow cytometry (%). r indicates the Pearson correlation coefficient. The correlation P ≤ 0.05 was considered to be significant, *P ≤ 0.05. The statistically significant correlation is indicated by red color.