
Figure 7.
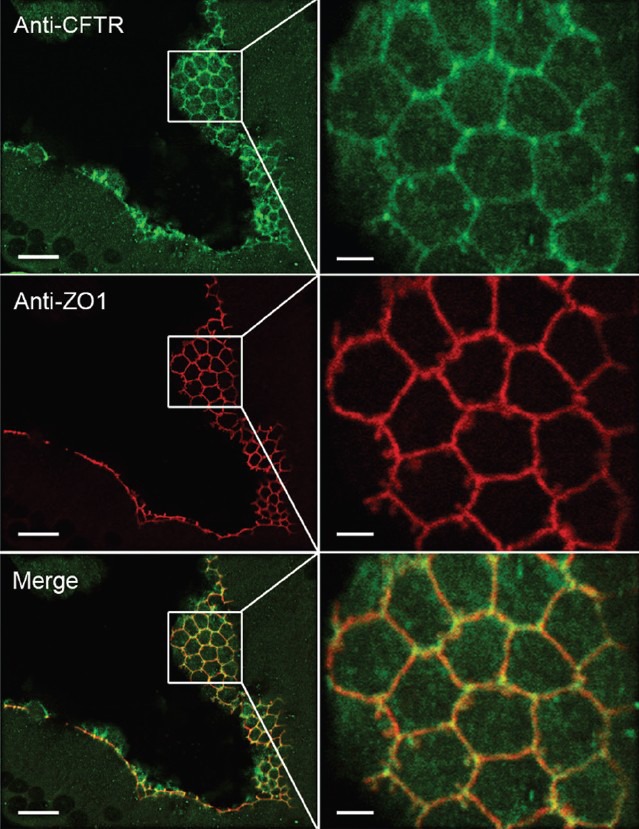
Co-localization of CFTR with ZO1 in TJs of the mouse initial segment. (Left panels) Confocal laser scanning microscope images showing CFTR (green) and ZO1 (red) labeling in TJs. (Right panels) Higher magnification images of the regions delineated in the boxes in the left panels. Co-localization of CFTR with ZO1 is indicated by the yellow/orange labeling in the merged panels. Scale bars: Left – 10 μm, Right – 2.5 μm. Modified from Ruan et al. J Cell Sci 2014.