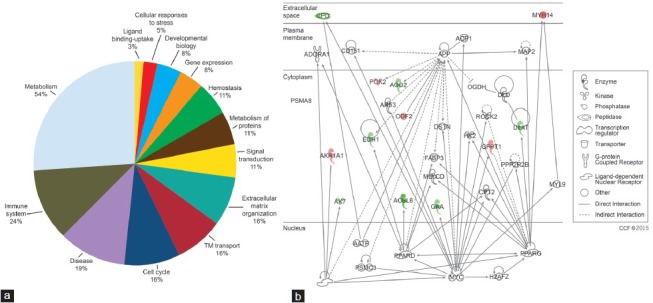
Figure 2.

Major pathways identified by the reactome database (a) DEP participating in metabolism, immune system, disease, signal transduction and other pathways and (b) Top disease and function networks and involvement of DEP in lipid metabolism. Green color shows that these DEP were underexpressed and red color shows overexpression of DEP in the fertile control group compared to the bilateral varicocele group respectively. Gradation of color reflects their intensity/abundance of expression (e.g., brighter the red, the greater the protein expression). DEP: differentially expressed protein.
