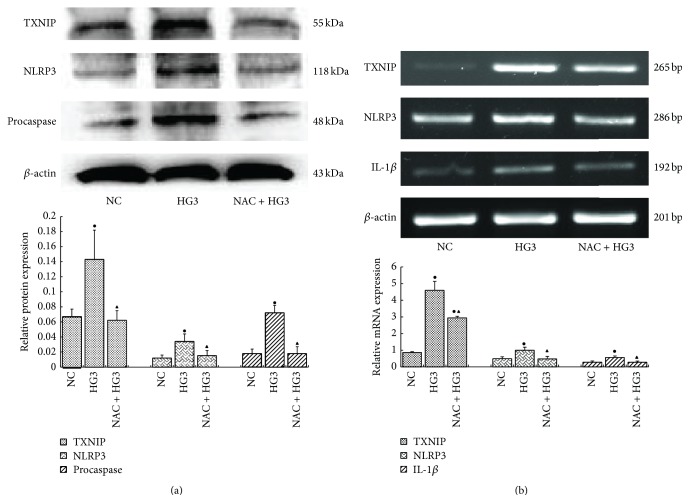
Figure 6.
Compared with the high glucose group (30 mmol/L), mRNA and protein levels of TXNIP, NLRP3, procaspase-1, and IL-1β were significantly lower in the high glucose (30 mmol/L) plus NAC group (a, b) (NC: 5.6 mmol/L glucose; HG3: 30 mmol/L glucose; NAC + HG3: 10 μmol/L NAC + 30 mmol/L glucose) (● p < 0.05 versus NC group, ▲ p < 0.05 versus HG3 group).

