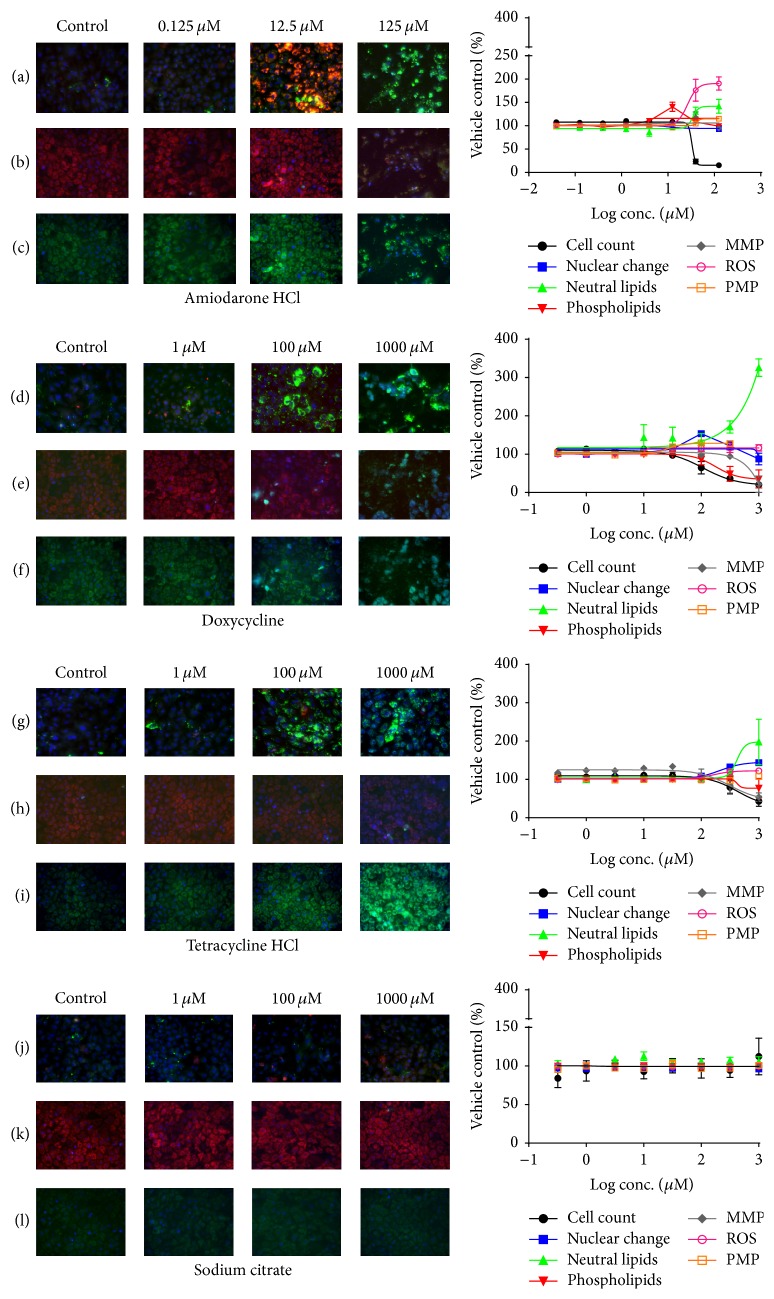
Figure 3.
Representative images of dose response effects of amiodarone HCl (a–c), doxycycline (d–f), tetracycline hydrochloride (g–i), and sodium citrate (j–l) at three different concentrations in hiPSC derived hepatocytes. Nuclei were detected by Hoechst 33342 (blue) staining in all images. Fluorescence of LipidTOX neutral lipids (green) and LipidTOX phospholipids (red) in rows (a), (d), (g), and (j) and MMP (red) and PMP (green) in (b), (e), (h), and (k). ROS (green) in (c), (f), (i), and (l), respectively. Values denoted are mean ± SEM (N = 3).

