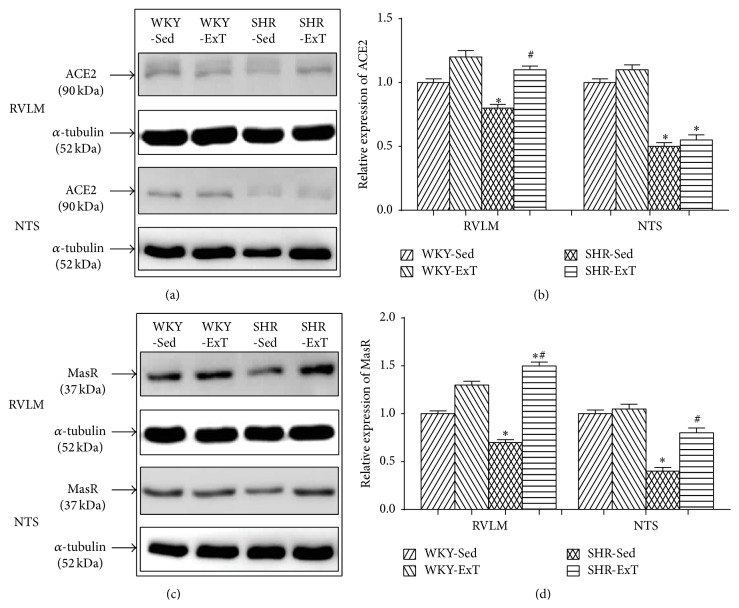
Figure 3.
Representative western blot (a, c) and densitometric analysis (b, d) of ACE2 and MasR in the RVLM and NTS of sedentary or exercised WKY and SHR groups. n = 5 in each group. ∗ P < 0.05 versus WKY-Sed; # P < 0.05 versus SHR-Sed. As to ACE2 in the RVLM, P value for WKY-SHR was <0.0001, P value for Sed-ExT was <0.0001, and P value for cross interactions was 0.0002; as to MasR in the RVLM, P value for WKY-SHR was 0.1891, P value for Sed-ExT was <0.0001, and P value for cross interactions was 0.0003; as to ACE2 in the NTS, P value for WKY-SHR was 0.0002, P value for Sed-ExT was 0.9242, and P value for cross interactions was 0.8496; as to MasR in the NTS, P value for WKY-SHR was 0.0075, P value for Sed-ExT was 0.0231, and P value for cross interactions was 0.0612.

