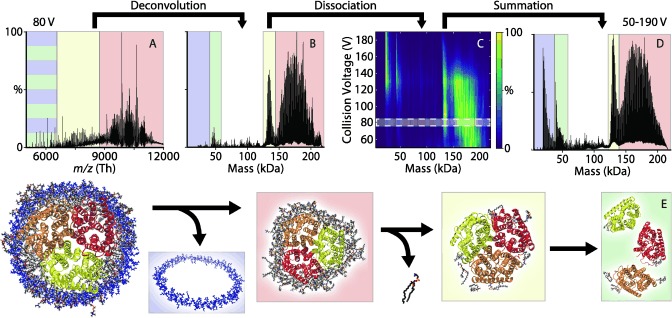
Figure 2.

Representative mass spectrum and deconvolution of AmtB nanodiscs with POPC and MSP1D1(−). A) Mass spectrum at 80 V CID deconvolves to yield B) the mass distribution. C) The mass distribution shifts to lower‐mass species with increasing collision energy. D) The average mass distribution over all CID states shows four distinct species, which are illustrated in (E): AmtB trimer with a broad mass distribution including tens of bound lipids (red), AmtB trimer with around nine bound lipids (yellow), AmtB monomer (green), and MSP (blue). These four states are similarly shaded in A, B, and D.
