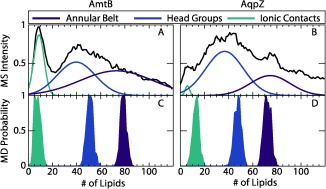
Figure 4.

Lipid distribution from MS averaged across all three types of nanodiscs for A) AmtB and B) AqpZ compared with lipid distributions determined from MD (C and D, for AmtB and AqpZ, respectively) for the annular belt (purple), the head group shell (blue), and the ionic contacts (cyan). MS distributions were fit to three overlapping Gaussian distributions. MD distributions are a histogram of individual measurements for each frame, which are shown in Figure S6.
