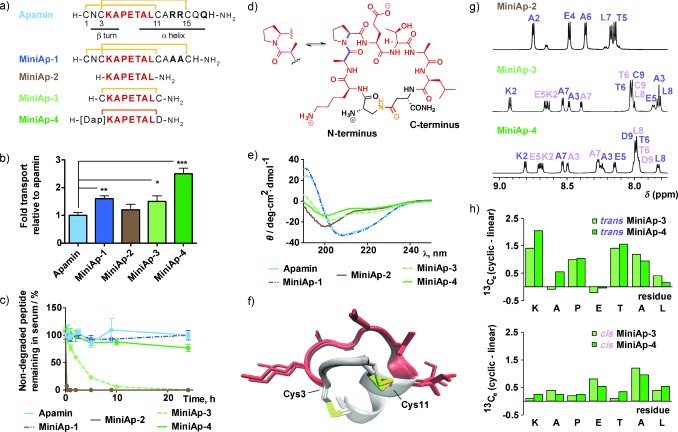
Figure 1.

Comparison of mini‐apamin shuttle candidates. a) Peptide sequences. The disulfides are depicted in yellow and the lactam bridge in orange. b) Relative transport of peptides in the bovine‐cell‐based model. c) Stability of the peptides in human serum. d) Molecular representation of MiniAp‐4, showing the equilibrium between the trans and cis Ala–Pro conformations. e) CD spectra. f) The three lowest‐energy NMR structures of MiniAp‐1. g) Amide regions of the 1H NMR spectra of MiniAp‐2, MiniAp‐3, and MiniAp‐4. The amide resonances of the trans (purple) and cis (pink) conformers are labeled. h) Comparison of the 13Cα chemical shift values of the linear derivative (MiniAp‐2) and the trans (top) and cis (bottom) conformers of the cyclic analogues (MiniAp‐3 and MiniAp‐4). In Figure 1 b and c, error bars represent the standard error of the mean (SEM; n=3, *p<0.05, **p<0.01, ***p<0.001).
