Figure 2.

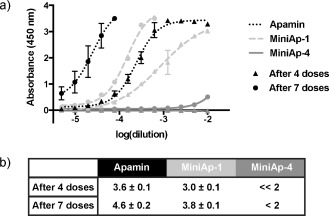
IgG titrations. a) Absorbance in the ELISA plate versus serum dilution. b) Antibody titer reported as −log (EC50). n=4 for apamin and MiniAp‐4, n=2 for MiniAp‐1. Error bars represent the standard deviation.

IgG titrations. a) Absorbance in the ELISA plate versus serum dilution. b) Antibody titer reported as −log (EC50). n=4 for apamin and MiniAp‐4, n=2 for MiniAp‐1. Error bars represent the standard deviation.