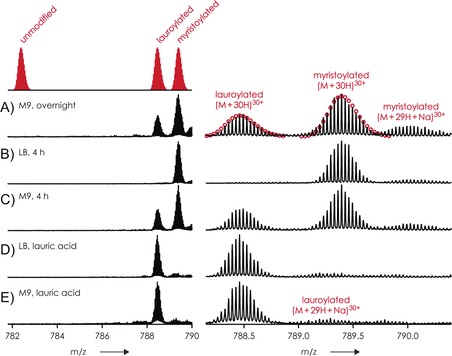
Figure 2.

Proportion of N‐myristoylated and N‐lauroylated forms of BASP under different expression conditions. ESI spectra of human BASP co‐expressed with hNMT in A) M9 overnight, supplemented with myristic acid, B) LB for 4 h, supplemented with myristic acid, C) M9 for 4 h, supplemented with myristic acid, D) and E) LB and M9, respectively, supplemented with lauric acid; red circles in (A) show calculated isotopic profiles for [M+30 H]30+ ions of lauroylated and myristoylated protein.
