Figure 5.

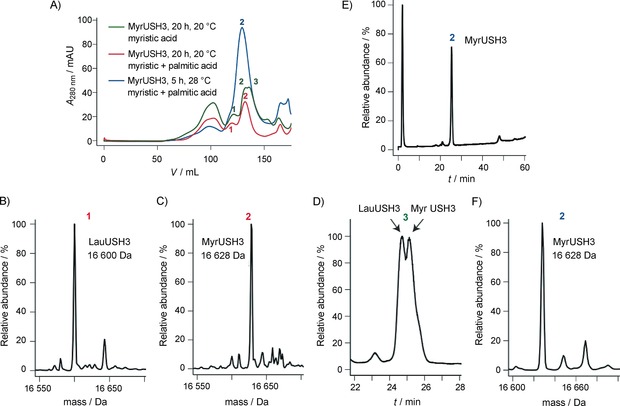
A) Size‐exclusion chromatography profiles of acylated USH3 expressed under different conditions. Red curve: in Rosetta cells, in the presence of both myristic and palmitic acid (20 h, 20 °C), two elution peaks are observed. Green curve: in T7 cells, in the presence only of myristic acid (20 h, 20 °C), three elution peaks are observed. Blue curve: in T7 cells, in the presence of both myristic and palmitic acid (5 h, 28 °C), one elution peak is observed. B) and C) Mass spectrometric analysis after separate pooling of the fractions corresponding to peaks 1 and 2, respectively. D) RP‐HPLC analysis of peak 3 of the red curve in (A) after pooling of its fractions. E) and F) RP‐HPLC and MS analysis of peak 2 of the blue curve after pooling of its fractions.
