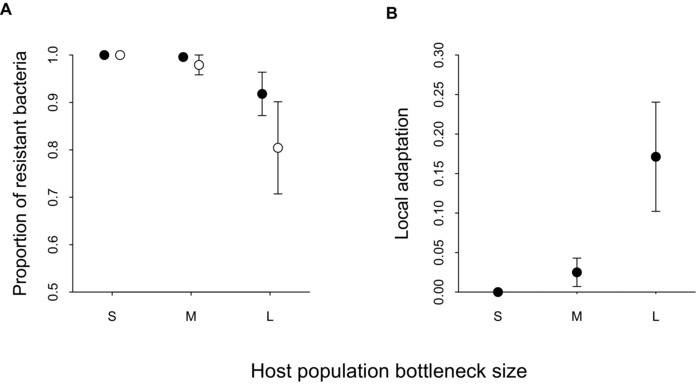
Figure 2.

The effect of host population bottleneck size (S = small, M = medium, and L = large) on (A) bacterial resistance to sympatric (filled dots) and allopatric (open dots) phages; and (B) local adaptation measured after two transfers. Bars display one SE.
