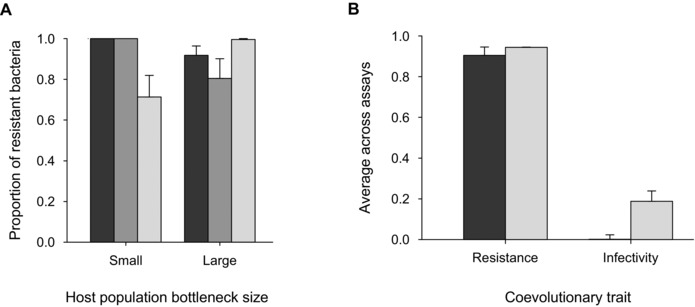
Figure 3.

(A) Bacterial resistance to infection by phages (sympatric = black, within‐allopatric = dark gray, between‐allopatric = light gray) in small versus large host populations. (B) Bacterial resistance and phage infectivity in small (black) and large (gray) host populations when averaged across resistance assays. Bars display one SE.
