Figure 3.

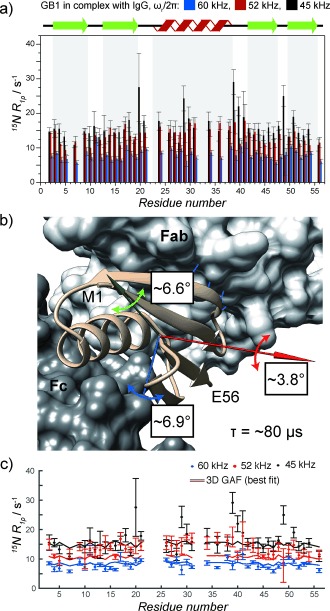
a) 15N R 1ρ rates for GB1 in complex with IgG measured at 60 kHz (blue bars; ω 1N/2π=17 kHz), 52 kHz (red bars; ω 1N/2π=13.1 kHz), and 45 kHz (black bars; ω 1N/2π=13 kHz) spinning frequency at 850 MHz 1H Larmor frequency and a sample temperature of 27±1 °C. b) Visualization of the overall 3D GAF motion of GB1 in the complex with IgG consistent with the data in (a). The amplitudes of fluctuations are listed next to the axes of motion. The approximate correlation time for the motion is 80 μs. c) Comparison of 15N R 1ρ rates back‐calculated from the best‐fit to the 3D GAF model in (b) to experimental rates.
