
Fig. 5.
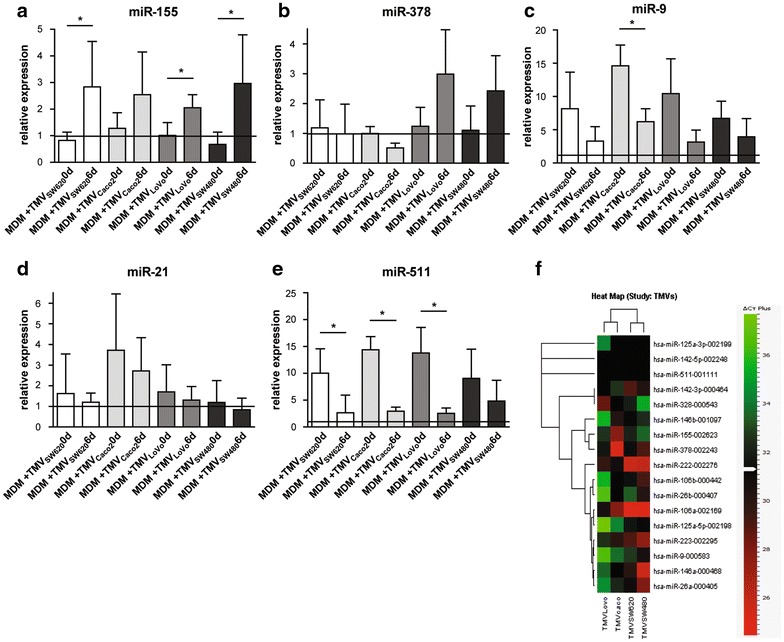
Expression of selected (involved in the MDM differentiation process) microRNAs in MDM + TMV0d and MDM + TMV6d vs control MDM (black line at level 1) presented as relative expression normalized to U6 (2−ΔΔCT): miR-155 (a), miR-378 (b), miR-9 (c), miR-21 (d), miR-511 (e). Heat map of microRNA involved in MDM differentiation process detected in TMVs alone (f). Data from 3 independent experiments, performed in triplicates (mean ± SD) are shown. *p < 0.05