
Fig. 8.
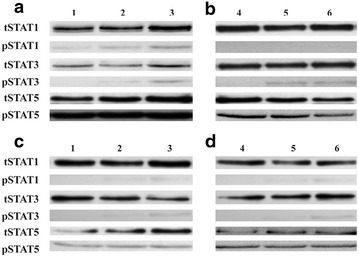
Western-blot analysis of STAT1, 3 and 5 phosphorylation. Monocytes isolated from blood of 2 donors were used: donor 1 (a and c), donor 2 (b and d). a and b represents MDM0d, c and d represents MDM6d. Control MDM (1 and 4), MDM + TMVLoVo (2), MDM + TMVSW480 (3), MDM + TMVSW620 (5) MDM + TMVCaco2 (6). One representative experiment out of two performed is presented