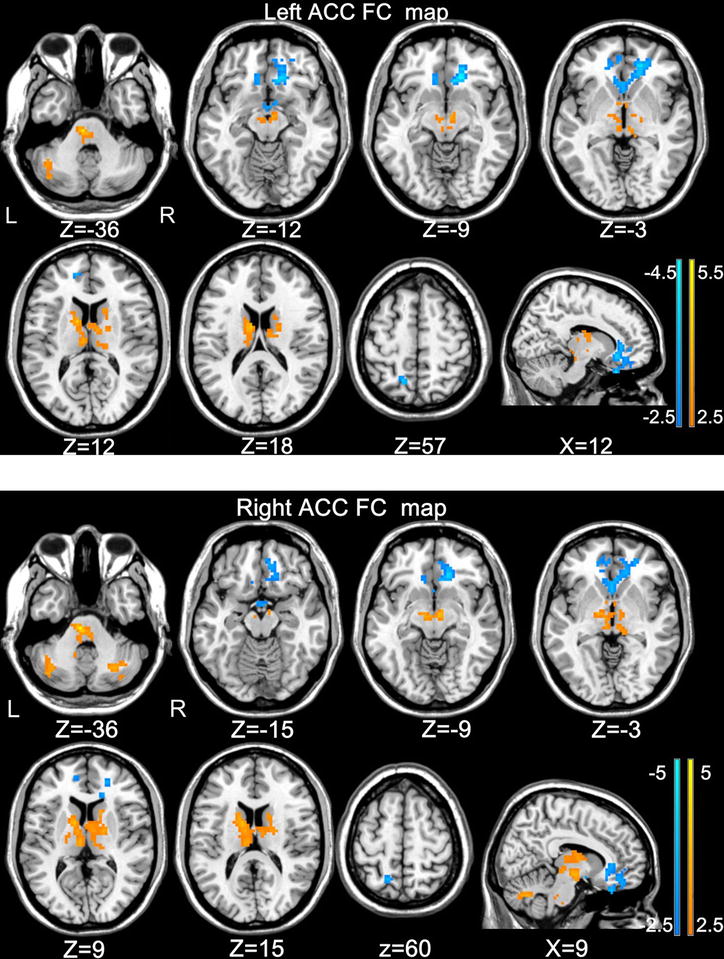
Fig. 2.

Significant differences in the functional connectivity from the left ACC and right ACC to whole brain between BQD individuals and healthy controls. Thresholds were set at a corrected P < 0.01, determined by Monte Carlo simulation. For display purposes only, all statistical maps are overlaid on a T1-weighted MNI template using MRIcron (ACC anterior cingulate cortex, BQD betel quid dependence, MNI montreal neurological institute)
