Fig. 6.

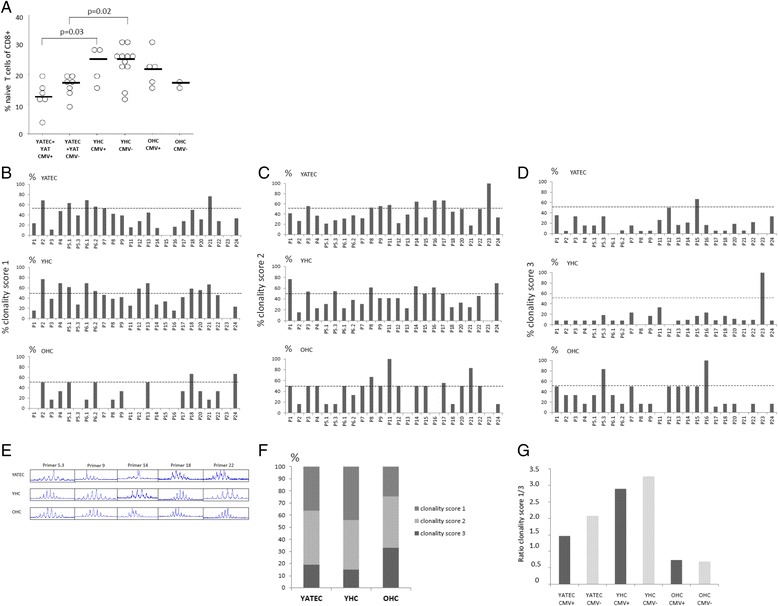
Association between CMV-seropositivity, proportions of naive T cells and TCR Vβ repertoire diversity. No significant differences were seen between CMV positive (CMV+) or negative (CMV-) YATEC patients or YHC regarding proportions of naive CD4+ T cells (a). CMV positive YATEC patients had lower proportions of naive CD8+ T cells than CMV positive YHC and CMV negative YATEC (b). Horizontal line indicates the median. A p ≤ 0.05 indicates statistical significance (Mann–Whitney U test). Percentages of clonality score 1 (polyclonal) (c), score 2 (oligoclonal) (d) and score 3 (monoclonal) (e) are given for all evaluated Vβ families for YATEC patients, YHC and OHC. An arbitrary dotted line indicates 50 % reaching clonality score (C-E). Representative repertoire profiles for 5 out of 24 evaluated Vβ family primers are provided for one YATEC patient, one YHC and one OHC showing a skewed TCR repertoire in YATEC and OHC (f). More monoclonal (clonality score 3) and less polyclonal distributions (clonality score 1) were found in YATEC patients and OHC compared to YHC (g). The polyclonal/monoclonal distribution ratio (ratio clonality score 1/3) was lower in CMV positive YATEC and YHC compared to CMV negative individuals (h). Lower ratios were found in YATEC patients compared to YHC, with lowest ratios in OHC (h). Data represent a trend of scores, but differences between distributions (polyclonal/monoclonal) and CMV serostatus (positive/negative) did not reach statistical significance in any group (X 2 test)
