Figure 5.
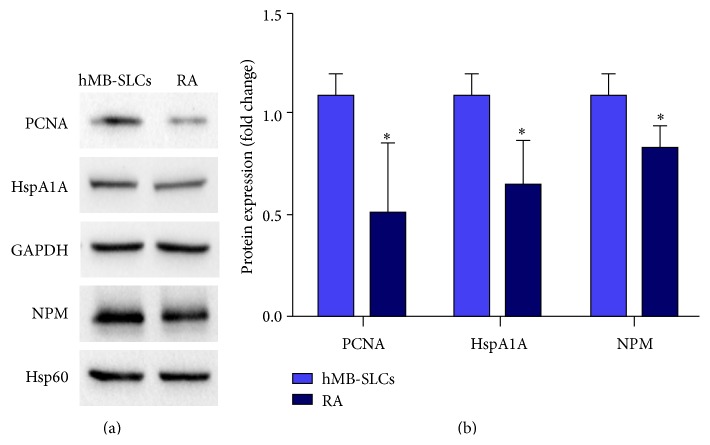
WB validation. (a) Western blot analysis of NPM, PCNA, and HspA1A in hMB-SLCs and in 48 h RA-treated cells. Hsp60 and GAPDH were used as control for equal protein load. (b) Densitometric analysis confirmed the significant differential expression observed by proteomic analysis. The protein expression, normalized to Hsp60 expression for NPM and GAPDH expression for the other proteins, represents the mean ± SEM from three independent experiments. ∗ denotes p < 0.05 versus hMB-SLCs.

