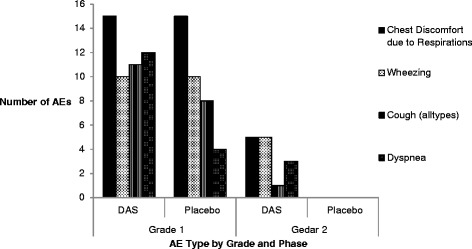
Fig. 4.

Distribution of most common adverse event types by study period and grade. The respiratory symptoms depicted in this figure accounted for 99 adverse events and represented four of the most common adverse events overall. The variable depicted as “Cough (all types)” included all cough related AEs including dry cough, cough not otherwise specified, and productive cough. The majority of AEs were grade 1, however all grade 2 AEs in this group occurred during the active period
