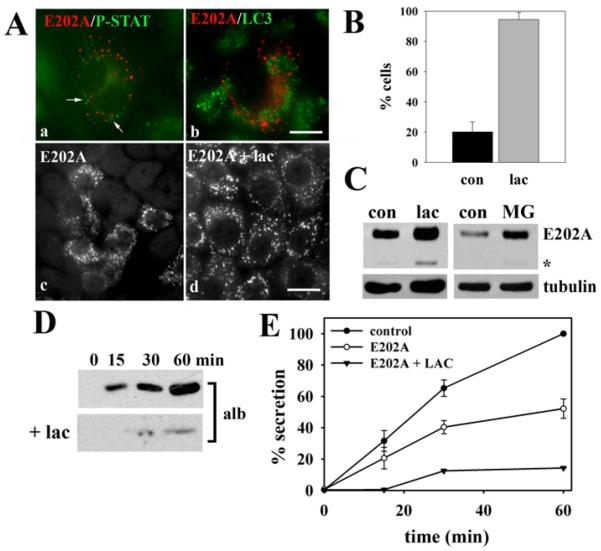
Figure 5. E202A associates with proteasomes.
(A) Cells expressing E202A were double-labelled for E202A and ProteoStat (a) or LC3 (b). E202A-expressing cells were incubated in the absence (c) or presence (d) of 5 μM lactacystin (lac) for 4 h and stained for E202A. Scale bar, 10 μm. (B) WIF-B cells were scored for E202A labelling after incubation in the absence (con) or presence (Lac) of 5 μm lactacystin for 4 h. The percentage of total cells positive for E202A labelling is plotted. Values are expressed as the means±S.E.M. Measurements were performed on at least three independent experiments. (C) E202A-expressing cells were incubated with 5 μM lactacystin for 4 h or 5 μM MG132 (MG) for 3 h. Cells wer−e lysed and immunoblotted for E202A and tubulin (as a loading control) as indicated. (D) E202A-expressing cells were treated in the absence or presence of 5 μM lactacystin for 4 h and the secretion assay was performed as described in Figure 3. (E) Secretion levels of control, E202A-infected, and E202A-infected plus lactacystin (LAC) were calculated from the densitometric analysis of immunoreactive bands shown in (D). Values for control and E202A are expressed as the means±S.E.M. measured from three independent experiments. Values for E202A plus lactacystin are expressed as the mean from two independent experiments.

