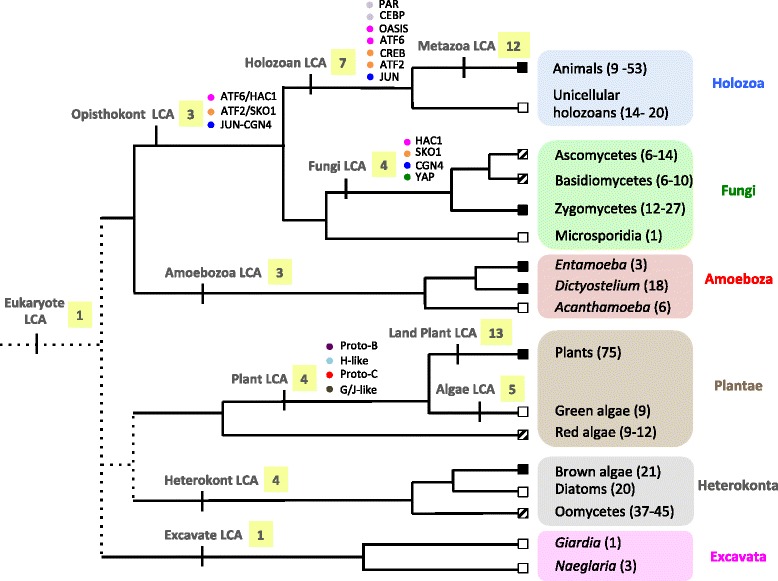
Fig. 5.

A model for the eukaryotic bZIP evolution. A simplified phylogenetic tree of the eukaryotes is depicted. Phylogenetic relationships are based on the most commonly accepted view of the phylogeny of the Eukaryotes [59]. A white square indicates multicellular lineages; a black square indicates unicellular lineages; a black and white square indicate lineages comprising both multicellular and unicellular species. In parentheses, we reported the range of bZIPs we identified in the species sampled in this study. The estimated number of bZIPs in each last common ancestor (LCA) is indicated in a yellow box next to its name. When possible, we indicate the inferred bZIP families by a circle. Two circles have the same colour when they are thought to have originated from the same protein
