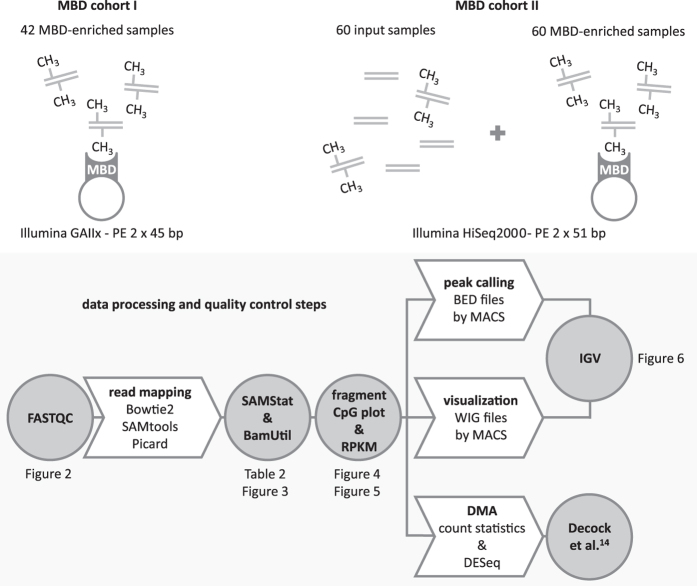
Figure 1. The MBD sequencing data of 102 primary neuroblastoma tumors are processed using different analysis tools.
Depicted are the available MBD sequencing data sets and downstream data processing and technical validation steps. These steps are represented as arrows and circles, respectively. For each step, the applied tool or analysis is indicated. For the technical validation steps, also the corresponding data descriptor figures and tables are indicated. DMA, differential methylation analysis; IGV, Integrative Genomics Viewer; PE, paired-end; RPKM, reads per kilobase CpG island per million.

