
Figure 5.
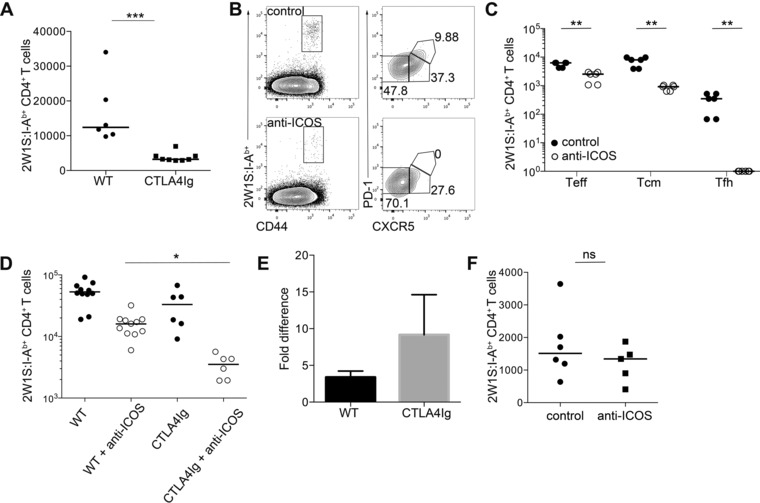
Therapeutic combination of blocking anti‐ICOS mAb and CTLA4Ig enhances blockade of CD4+ T‐cell response. (A) WT and CTLA4Ig mice were infected with Lm‐2W1S. CD44hi 2W1S:I‐Ab+ CD4+ memory T cells were enumerated 28 dpi by flow cytometry. (B and C) CTLA4Ig mice were infected with Lm‐2W1S and treated with anti‐ICOS or isotype control mAb 0 and 3 dpi. (B) CD44hi 2W1S:I‐Ab+ CD4+ T cells were stained for CXCR5 and PD‐1 expression 7 dpi and analyzed by flow cytometry. Plots are representative of ≥6 mice from three independent experiments. Values on plots are percentages. (C) CD44hi2W1S:I‐Ab+CD4+ CXCR5− (Teff), CXCR5+ (Tcm precursors), and CXCR5+PD−1+ (Tfh) cells were enumerated 7 dpi from control and anti‐ICOS treated mice. (D) CD44hi 2W1S:I‐Ab+ CD4+ T cells were enumerated 7 dpi from WT and CTLA4Ig mice treated with anti‐ICOS or isotype control mAb 0 and 3 dpi. Kruskal–Wallis one‐way ANOVA with post hoc Dunn's test: *p ≤ 0.05. (E) Fold difference between mice treated with anti‐ICOS or isotype control mAb in number of CD44hi 2W1S:I‐Ab+ CD4+ T cells in WT and CTLA4Ig mice. Bars show mean + SEM of fold difference between experiments. (F) CD44hi 2W1S:I‐Ab+ CD4+ memory T cells were enumerated from CTLA4Ig mice 28 dpi with Lm‐2W1S, treated with blocking anti‐ICOS or isotype control mAb twice weekly for 4 weeks. (A, C–F) Graphs show pooled data from ≥2 independent experiments. Values of 0 were assigned as 1. Each data point represents one mouse; bars show medians. Mann–Whitney test: ns p > 0.05, **p ≤ 0.01, ***p ≤ 0.001.