
Figure 2.
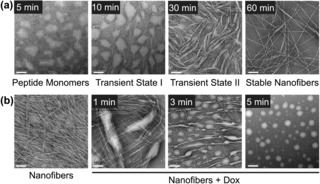
a) Self‐assembly process of CAP analyzed by TEM. CAP concentration, 0.05 mg mL−1. b) TEM examination of morphology changes of peptide nanocarriers during loading of hydrophobic Dox. Scale bars: 100 nm.
Official websites use .gov
A
.gov website belongs to an official
government organization in the United States.
Secure .gov websites use HTTPS
A lock (
) or https:// means you've safely
connected to the .gov website. Share sensitive
information only on official, secure websites.
a) Self‐assembly process of CAP analyzed by TEM. CAP concentration, 0.05 mg mL−1. b) TEM examination of morphology changes of peptide nanocarriers during loading of hydrophobic Dox. Scale bars: 100 nm.